Access email campaign reports
Go to "Campaigns" -- "All Campaigns" Scroll to the email campaign and towards the end of that row click on the "Settings" icon From the options, choose the "Overview" button (Infor...
-
Go to "Campaigns" --> "All Campaigns"
-
Scroll to the email campaign and towards the end of that row click on the "Settings" icon
-
From the options, choose the "Overview" button (Information icon).
-
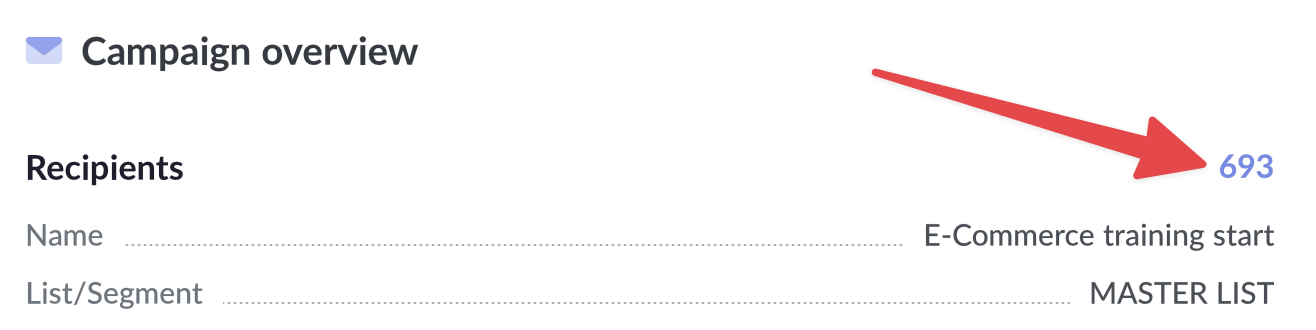
To further drill down and see what happened to each email, click on the blue number. The number is the number of emails that have been sent. It looks similar to the image below.
Campaign Report
Overview
-
Recipients - Total number of recipients for this campaign
-
Name - Name of the email campaign
-
List/Segment - The specific list or segment used for this campaign
-
Subject - The subject line of the email
-
Last open - Timestamp of the most recent email open
-
Started at - Time when the campaign sending began
-
Finished at - Time when the campaign sending completed
Details
Left column:
-
Type - The type of email campaign (e.g., Regular)
-
From name - Name displayed as the sender of the email
-
From email - Email address used to send the campaign
-
Reply to - Email address for recipient replies
-
To name - Format used for recipient names in the email
-
Web version - Link to view the email in a web browser
Right column:
-
Forwards - Number of times the email was forwarded
-
Abuse reports - Number of abuse reports received for this campaign
-
Date added - Date when the campaign was created or added to the system
-
Send at - Scheduled time for sending the campaign
-
Total delivery time - Time taken to deliver all emails in the campaign
-
Delivery servers - Information about the servers used to deliver the emails
Tracking Stats
-
Opens - Total number of times the email was opened
-
Clicks - Total number of clicks on links within the email
-
Unsubscribes - Number of recipients who unsubscribed from the mailing list
-
Complaints - Number of recipients who marked the email as spam
-
Bounces - Number of emails that could not be delivered
If you click through on any of the blue numbers (Eg. XX opens), it will take you to a report focusing on just that aspect. So you can drill down to actions taken by a specific contact.
Drill-down metrics
-
Clicks rate - Percentage of recipients who clicked on links in the email
-
Unique clicks - Number and percentage of unique recipients who clicked
-
Total clicks - Total number and percentage of all clicks (including multiple clicks by the same recipient)
-
Clicks to opens rate - Percentage of email opens that resulted in clicks
-
Click through rate - Percentage of total recipients who clicked on a link
-
Opens rate - Percentage of recipients who opened the email
-
Unique opens - Number and percentage of unique recipients who opened the email
-
Total opens - Total number and percentage of all opens (including multiple opens by the same recipient)
-
Opens to clicks rate - Percentage of clicks that resulted from email opens
-
Bounce rate - Percentage of emails that were not delivered
-
Hard bounces - Number and percentage of permanent delivery failures
-
Soft bounces - Number and percentage of temporary delivery failures
-
Internal bounces - Number and percentage of bounces within the organization
-
Unsubscribe rate - Percentage of recipients who unsubscribed
-
Unsubscribes - Total number of unsubscribes
-
Complaints rate - Percentage of recipients who marked the email as spam
-
Complaints - Total number of spam complaints
24-Hour Performance - Graph
-
Visual representation of email performance over the first 24 hours after sending
-
X-axis: Time in hours
-
Y-axis: Number of interactions
-
Blue line: Opens over time
-
Green line: Clicks over time
Top domains for all opens and clicks - Bar graph
-
Visual representation of email engagement by domain
-
X-axis: Email domains (e.g., amazon.com, pepsico.com, fortinet.com)
-
Y-axis: Number of interactions
-
Blue bars: Number of opens for each domain
-
Green bars: Number of clicks for each domain
-
This graph allows marketers to identify which email domains are most engaged with the campaign, both in terms of opens and clicks.
Campaign Geo Opens - Pie chart
-
Visual representation of email opens by geographical location
-
Shows the distribution of opens across different countries
-
Each slice represents a country, with its size proportional to the number of opens
-
Legend lists countries, number of opens, and percentage of total opens
-
Country list - Tabular breakdown of opens by country- Columns: Country flag, Country name, Total opens
-
Options to view details, export all data, or view unique opens for each country
-
This section helps marketers understand the geographical reach and engagement of their email campaign, which can be useful for targeting and localisation efforts.
Subscribers opens info based on user agent - Operating systems
-
Pie chart showing distribution of operating systems used to open the email
-
Displays percentage and count for each OS (e.g., Windows, iOS, OS X, Android)
-
Helps identify which operating systems are most common among subscribers
-
Devices - Pie chart illustrating the types of devices used to open the email - Shows percentage and count for each device type (e.g., Desktop, Mobile)
-
Indicates whether subscribers are primarily accessing emails on desktop or mobile devices
-
Browsers - Pie chart representing the browsers used to open the email - Lists percentage and count for various browsers (e.g., Chrome, Firefox, Edge)
-
Helps understand which browsers are most popular among subscribers
-
This section provides insights into the technical environment of subscribers, which can inform design and compatibility decisions for future campaigns
Top-clicked links - Link list
-
Table showing the most frequently clicked links in the email- Columns: URL of the link, Number of clicks
-
Sorted by number of clicks in descending order
-
Typically shows the top 4-5 most clicked links
-
View options - "View all clicks" button - Likely provides a more comprehensive list of all clicked links
-
"View top clicks" button - Probably offers a more detailed analysis of the most popular links
-
This section helps identify which content or calls-to-action in the email were most effective at driving engagement
Latest Clicked Links - Link list
-
Table showing the most recently clicked links in the email - Columns: URL of the link, Subscriber's email address, Timestamp of the click
-
Sorted by timestamp in descending order (most recent at the top)
-
Includes both content links and unsubscribe links
-
View options - "View all clicks" button - Likely provides a comprehensive list of all clicked links
-
"View latest clicks" button - Probably offers a more detailed view of recent click activity
-
This section helps track real-time engagement and identify which subscribers are interacting with the email most recently
Latest Opens - Open list
-
Table showing the most recent email opens - Columns: Subscriber's email address, Timestamp of the open
-
Sorted by timestamp in descending order (most recent at the top)
-
Typically shows the last 10 opens
-
View details button - Likely provides more comprehensive information about email opens
-
This section helps monitor real-time engagement and identify which subscribers are currently active
Subscribers with most Opens - Subscriber list
-
Table showing subscribers who have opened the email multiple times - Columns: Subscriber's email address, Number of opens
-
Sorted by number of opens in descending order
-
Typically shows the top 10 most engaged subscribers
-
View details button - Probably offers more in-depth information about subscriber engagement
-
This section helps identify the most engaged subscribers, which can be valuable for targeting and personalisation efforts
Activity map - Interactive world map
-
Visual representation of email campaign activity across the globe- Based on Google Maps or a similar mapping service
-
Shows geographical distribution of email interactions
-
View options - "Enter full screen" button - Allows for a larger, more detailed view of the map
-
Toggle buttons for "Opens", "Clicks" and"Unsubscribes" - Likely filter the map to show specific types of interactions
-
Map controls - Zoom in/out buttons (+/-) - Allow users to focus on specific regions
-
Map/Satellite toggle - Switches between standard map view and satellite imagery
-
Full-screen button - Expands the map to fill the entire screen
-
Activity indicators - Blue dots on the map - represent locations where email activity occurred
-
(Note: In this specific image, there appears to be one primary blue dot visible in the Europe region)
-
Scale - Provides a distance reference (1000 km in this image)
Related articles
Domain Auth SPF, DKIM, DMARC, MX
Note: This guide only helps with email authentication for the emails (Eg. Email notifications) sent using OUR delivery server we configured for you. It DOES NOT apply if you are us...
Using Stripo email template builder
Step 1 Go to the 'Email templates' menu from the left and click on 'Create new'. Step 2 Once loaded, click on the 'Show email builder' link in the top right corner of the WYSIWYG e...
Email campaigns paused - 'pending-sending'
You ran out of your monthly allowance We enforce limits from the backend. Our system automatically disables once your customers have used up their sending allowance. The counter ca...